Stellar classification (astrophysics)
Stellar classification is the categorization of stars by various properties. A common classification is surface temperature. Beginning with early spectral schema[1] in the 19th century ranking stars from A to P, the spectral classification, called “Morgan-Keenan spectral classification” [2][3] now ranks stars in seven main types: O, B, A, F, G, K, M.[4] Each spectral classification is further divided into tenths. Our sun, Sol, is a G2.
History
In 1801, William Hyde Wollaston (1766-1828) noted absorption lines in the solar spectrum. The solar spectrum was not a continuous band of colour and included a series of dark lines. Wollaston perceived this as a possible boundary between colours.[5]
Joseph von Fraunhofer (1787-1826) in 1814, studied this phenomena and concluded that the dark bands represented specific wavelengths.[6]
In 1863, Sir William Huggins (1824-1910) employed the research of Fraunhofer, Gustav Robert Kirchhoff and Robert Wilhelm Eberhard Bunsen to lay the final piece of the puzzle in place and compared these solar spectrums with other stars and terrestrial substances.[7] In this way it was demonstrated that the dark bands, now known as Fraunhofer Lines, are the absorption lines for chemical elements present in the stars. Specific chemicals present in the outer layers of a star absorb specific wavelengths creating the dark lines. This also showed that the stars are made of the same substances here on Earth.[8]
While this work provided for the foundation of the field of spectroscopy it also provided a tool for astrophysics and astronomy. These distinctive spectral lines which provide information about the chemical composition of the stars have become the basis for their classification.
Classification system
The stars are ranked from hottest to coldest:
| Class | Temperature | Conventional vs Apparent color | Characteristics | Mass [11] | Radius [12] | Luminosity [13] | Hydrogen lines | % of all MSSs[14][15] |
|---|---|---|---|---|---|---|---|---|
| O | 30,000–60,000 K | blue/blue | Ionized He & metals;
weak H |
10-70 M☉ | 15 R☉ | 1,400,000 L☉ | Weak | ~0.00003% |
| B | 10,000–30,000 K | blue white/blue white to white | Neutral He, ionized metals, stronger H | 18 M☉ | 7 R☉ | 20,000 L☉ | Medium | 0.13% |
| A | 7,500–10,000 K | white/white | Balmer H dominant, singly-ionized metals | 3.1 M☉ | 2.1 R☉ | 80 L☉ | Strong | 0.6% |
| F | 6,000–7,500 K | yellowish white/white | H weaker, neutral & singly-ionized metals | 1.7 M☉ | 1.3 R☉ | 6 L☉ | Medium | 3% |
| G | 5,000–6,000 K | yellow/yellow | Singly ionized Ca, H weaker, neutral metals | 1.1 M☉ | 1.1 R☉ | 1.2 L☉ | Weak | 8% |
| K | 3,500–5,000 K | orange/yellow orange | Neutral Metals, molecular bands begin to appear | 0.8 M☉ | 0.9 R☉ | 0.4 L☉ | Very weak | 13% |
| M | 2,000–3,500 K | red/orange red | Ti oxide molecular lines; neutral metals | 0.3 M☉ | 0.4 R☉ | 0.04 L☉ | Very weak | >78% |
Luminosity classes
Another schema for classifying stars is the Yerkes classification,[18] also known as M-K established in 1943.[19] This classification scheme measures surface gravities of stars by measuring the shape and nature of certain spectral lines.
| Ia | Most luminous supergiants |
|---|---|
| Ib | Less luminous super giants |
| II | Luminous giants |
| III | Normal giants |
| IV | Subgiants |
| V | Main sequence stars (dwarf) |
| VI | Main sequence stars (subdwarf) |
| VII | Main sequence stars (white dwarf) |
Stellar evolution
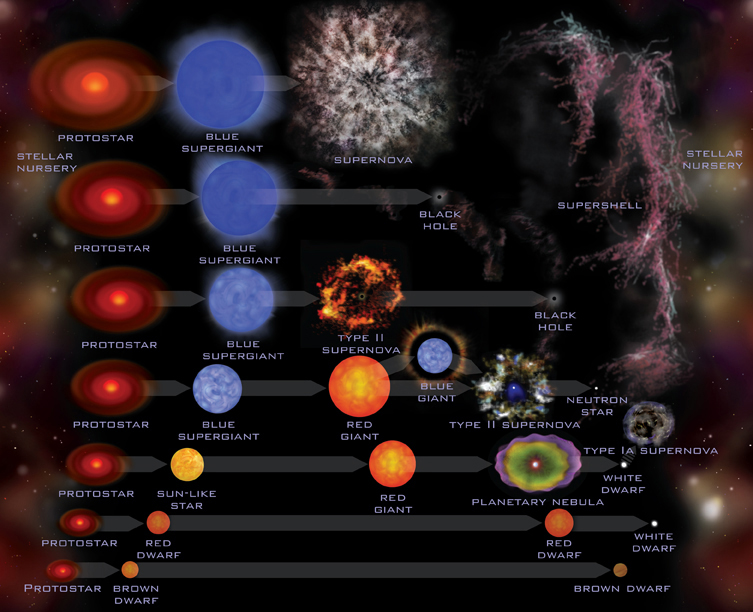
Depending on their mass, stars will undergo various stages in greatly varying lengths of time. Larger stars are shorter lived than the smallest and their transitions from one stage to another as they burn their fuel can be gradual, such as a red dwarf, or very explosive, such as the largest supergiant. The diagramme below shows the early stage of each class of star and their intermediate and final stages. The length of time roughly corresponds to distance they are spaced on the diagramme.
| Early stage | ||||
|---|---|---|---|---|
| Protostar | Blue supergiant | Supernova (final stage) | ||
| Protostar | Blue supergiant | Black hole (final stage) | ||
| Protostar | Blue supergiant | Type II Supernova | Black hole (final stage) | |
| Protostar | Blue supergiant | Red giant | Type II supernova | Neutron Star (final stage) |
| Protostar | Sun-like star | Red giant | Planetary nebula | White dwarf (final stage) |
| Protostar | Red dwarf | Red Dwarf | White Dwarf (final stage) | |
| Protostar | Brown dwarf | Brown dwarf (final stage) |
Until recently it was believed that blue supergiants would either burn their fuel and collapse into a black hole or undergo a massive explosion and then form a black hole. However, the recent discovery of SN 2006gy shows that at least in this one case, the initial explosion is so complete the largest blue supergiant is completely obliterated.[22]
For stars with a solar mass of about 10-25 (10-25 times the mass of earth's Sun) they will first become red giants. Usually they remain red giants until they explode. For stars with greater masses (more than approximately 20 solar masses) the process of evaporation and radiation pressure may blow out the outer layers and forming a blue giant before it explodes. SN1987A, for example, was apparently a blue giant before it exploded.[23]
Asymptomatic giant branch stars
R type stars
N type stars
Peculiar stars
Wolf-Rayet stars (WR)
T Tauri stars (T)
References
- ↑ Schema, the plural of scheme, refers to a way of organising or diagramming a body of facts or theories, virtually anything related that can be organised. The visible light spectrum scheme, for example, is ROYGBIV: red, orange, yellow, green, blue, indigo, and violet.
- ↑ Note: based on the work of Annie Cannon and other astronomers from the Harvard College Observatory
- ↑ Annie Jump Cannon 1883-1941
- ↑ A popular mnemonic for this (originally alphabetical) sequence is Oh Be A Fine Girl, Kiss Me Mnemonics for the Harvard Spectral Classification Scheme
- ↑ Note: Contemporary sources give varying dates for this discovery between 1801 and 1807. However, Sir William Huggins, in 1910, places this date at 1792. see Sir William Huggins W. W. Campbell (1910). Astronomical Society of the Pacific vol. XXIII, no. 133 page 153.; William Hyde Wollaston Hebrew University of Jerusalem, Institute of Chemistry; William Hyde Wollaston : 1766 – 1828 Dean P. Currier. Australian Centre for the moving image; William Hyde Wollaston Carl Zeiss AG; William Hyde Wollaston Michael W. Davidson, Florida State University; History of Solar Physics - A Time Line of Great Moments 1800-1999 National Center for Atmospheric Research & The UCAR Office Programs; William Hyde Wollaston (1766-1828) High Altitude Observatory, National Center for Atmospheric Research & The UCAR Office Programs
- ↑ Joseph von Fraunhofer High Altitude Observatory, National Center for Atmospheric Research & The UCAR Office Programs; Joseph von Fraunhofer New Advent Catholic Encyclopedia; Joseph von Fraunhofer Fraunhofer-Gesellschaft
- ↑ William Huggins (February 7, 1824 - May 12, 1910) Messier Catalog, Students for the Exploration and Development of Space; William Huggins 1904 Bruce Medalist Astronomical Society of the Pacific; Sir William Huggins, K.C.B., O.M. W.W. Campbell (1910) Astronomical Society of the Pacific; Gustav Robert Kirchhoff Institute of Chemistry, Hebrew University of Jerusalem
- ↑ Identificatio of spectral lines-History of Fraunhofer lines University of Ottawa; The Fraunhofer Lines Jet Propulsion Lab, California Institute of Technology, NASA
- ↑ The Colour of Stars. Australia Telescope Outreach and Education (December 21 2004). Retrieved on 2007-10-26. — Explains the reason for the difference in color perception.
- ↑ The Hertzasprung-Russell diagram (subsection The Harvard spectral sequence). University of Tennessee, Dept of Physics and Astronomy (unknown). Retrieved on 2007-10-26. — Details various aspects of stellar classification.
- ↑ NASA glossary Solar Mass. Earth's sun is one solar mass. Equal to about 2 X 10E30 kg or about 333,000 time the mass of the earth
- ↑ Solar Radius. Earth's sun is the standard with one solar radius equal to about 6.960 X 10E8 km. This is about twice the distance of the earth from the moon, 110 times the radius of earth, and 0.004652 AU (astronomical unit), the average distance of the earth from the sun. Solar Radius University of Oregon. The Corona Spartan 201. NASA
- ↑ Solar Luminosity. The standard is earth's sun equal to one solar luminosity. The luminosity of the sun is about 3.827 X 10E26 watts or 3.827 X 10E33 ergs
- ↑ MSS = Main Sequence Star
- ↑ LeDrew, G.; The Real Starry Sky, Journal of the Royal Astronomical Society of Canada, Vol. 95, No. 1 (whole No. 686, February 2001), pp. 32–33
- ↑ Star classification
- ↑ [1] Bechtold, Jill, Dept of Astronomy, Steward Observatory, University of Arizona
- ↑ Yerkes Observatory
- ↑ The physical basis of luminosity classification in the late A-, F-, and early G-type Stars. I. Precise spectral types for 372 stars Gray, R.O., Napier, M.G., Winkler, L.I. (2001) The Astronomical Journal April. 121:2148-2158. The American Astronomical Society; MKK are the initials of the authors Morgan, William W., Keenan, Philip C. and Kellman, Edith
- ↑ Classification of Stellar spectra website of Dept of Physics and Astronomy, University of Sheffield. Author: Jesse S. Allen, High Energy Astrophysics Science Archive Research Center. See [2] The page is also carried by Iowa Robotic Telescope Facilities, University of Iowa at [3]
- ↑ A new line of stellar evolution Supernovas and Remnants Chandra X-ray Observatory Retrieved 30, Oct, 2007
- ↑ Supernovas and remnants Chandra X-ray Observatory
- ↑ Supernova remnants and neutron stars Chandra X-ray Observatory